

Trending
The Pyramid trending functions are part of the chart reporting component and have been designed to calculate trend regressions using one of four models against a data series in the chart.
All trend lines added to a chart are simultaneously reflected in the chart legend, which will show the trend's regression equation as well as its R-Squared value.
Trend Functions
The trend lines drawn are based on the following 4 regression models:
- LINEAR using the formulation y = mx+b
- EXPONENTIAL using the formulation y = bemx
- LOGARITHMIC using the formulation y = mLn(x) + b
- POWER using the formulation y = bxm
where m is the slope of the trend line, b is the intercept, x is the independent variable and y is the dependent variable.
Trend Features
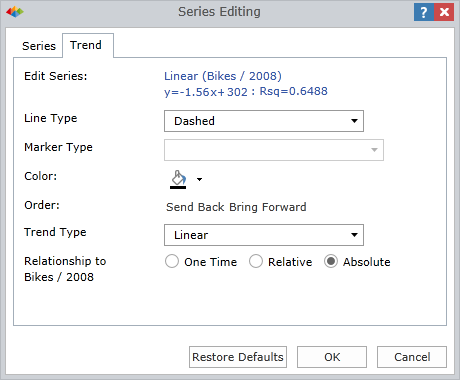
To add a trend, users can click the regression button from the chart ribbon tab, or right click on a chart data series and edit its settings from the context menu. In the series settings panel, users can add a trend line using one of the four above regression models. This in turn will enable the trend tab and users can make the following settings:
- Line Type - Choose line format for the trend line (Solid, Dashed or Dotted).
- Color - Choose color of trend line.
- Order - Choose visibility order in relation to other data series in plot area.
- Trend Type - Choose regression model for generating the trend line.
- Relationship to the data series source:
- One Time - Temporary calculation that will be lost when the underlying query is changed.
- Relative - Calculation against the set of data that occupies the same relative position from among all data series in the chart.
- Absolute - Calculation against this specific data series, regardless of how the query changes.
Edit and Remove
To edit or remove a trend, simply right click on its tag in the chart legend and choose Edit or Delete Trend from the context menu.
Home |
Table of Contents |
Index |
User Community
Pyramid Analytics © 2011-2022